About
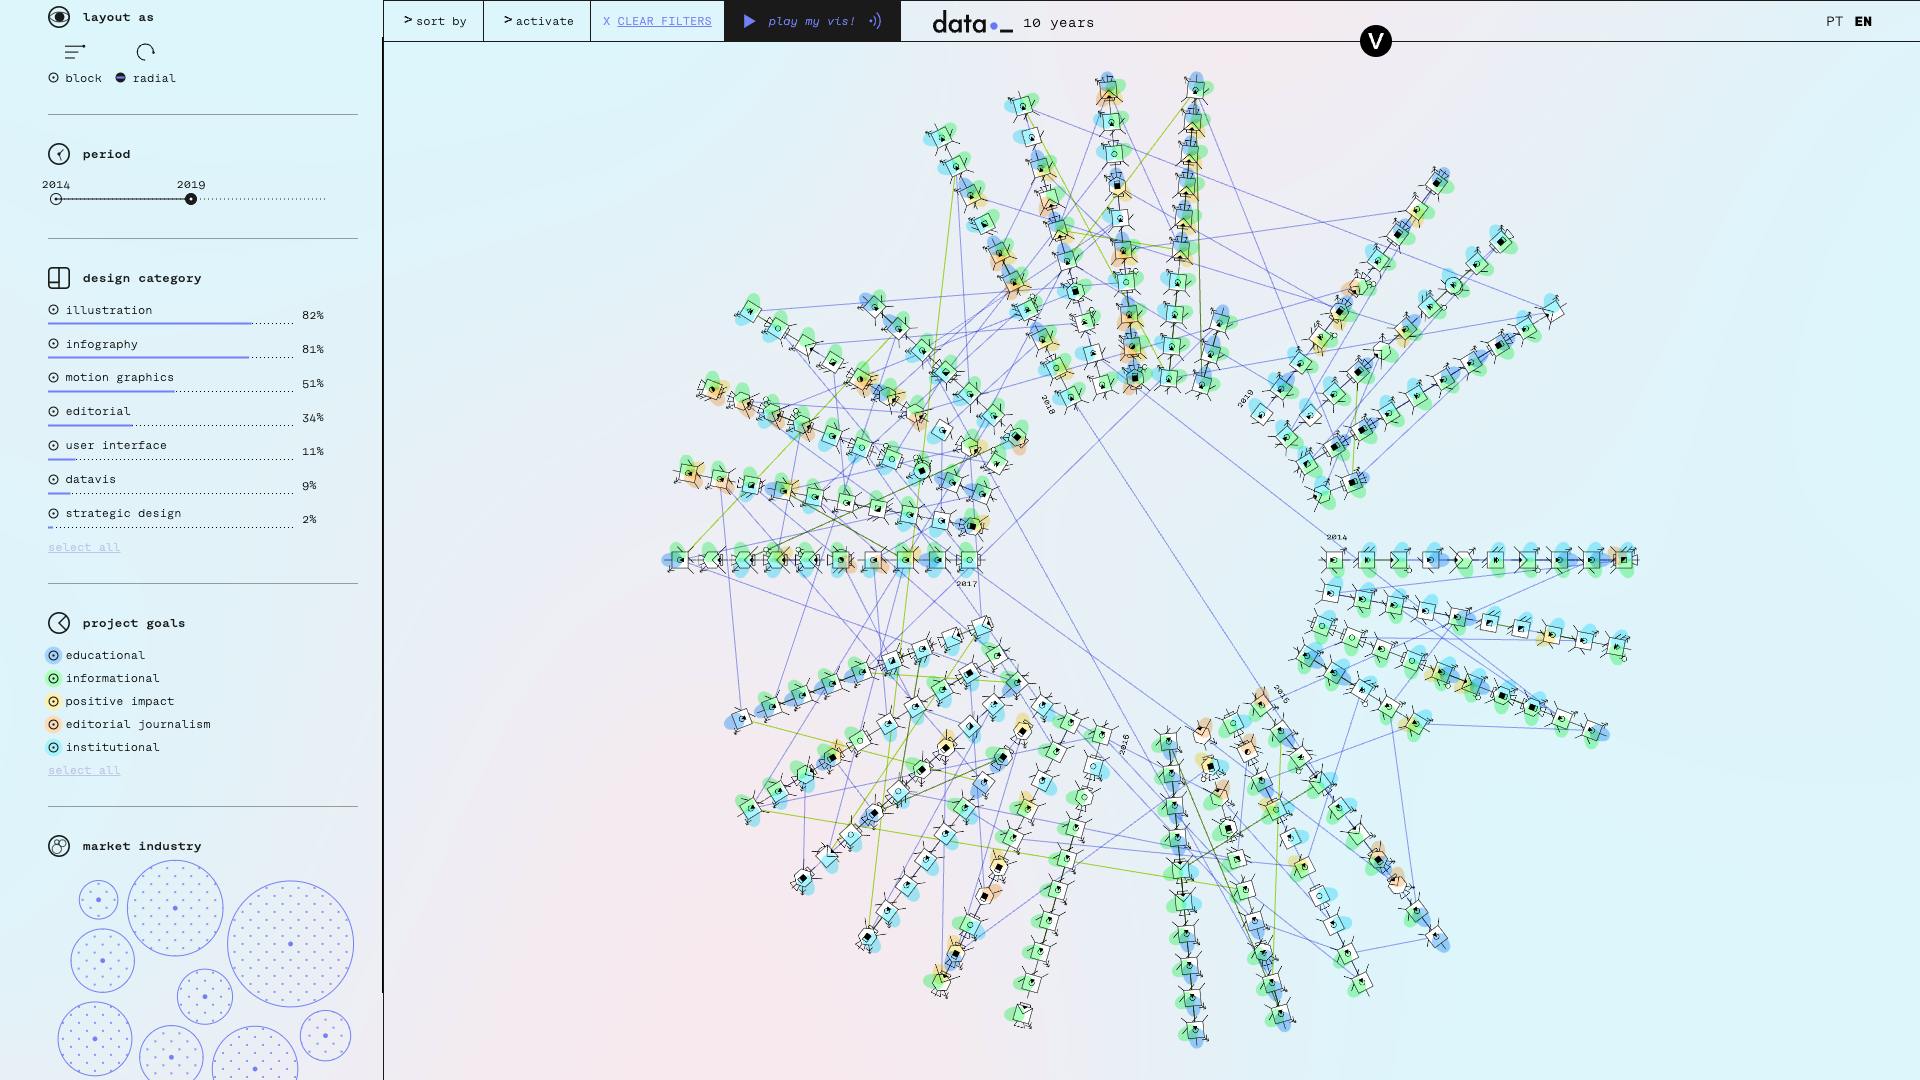
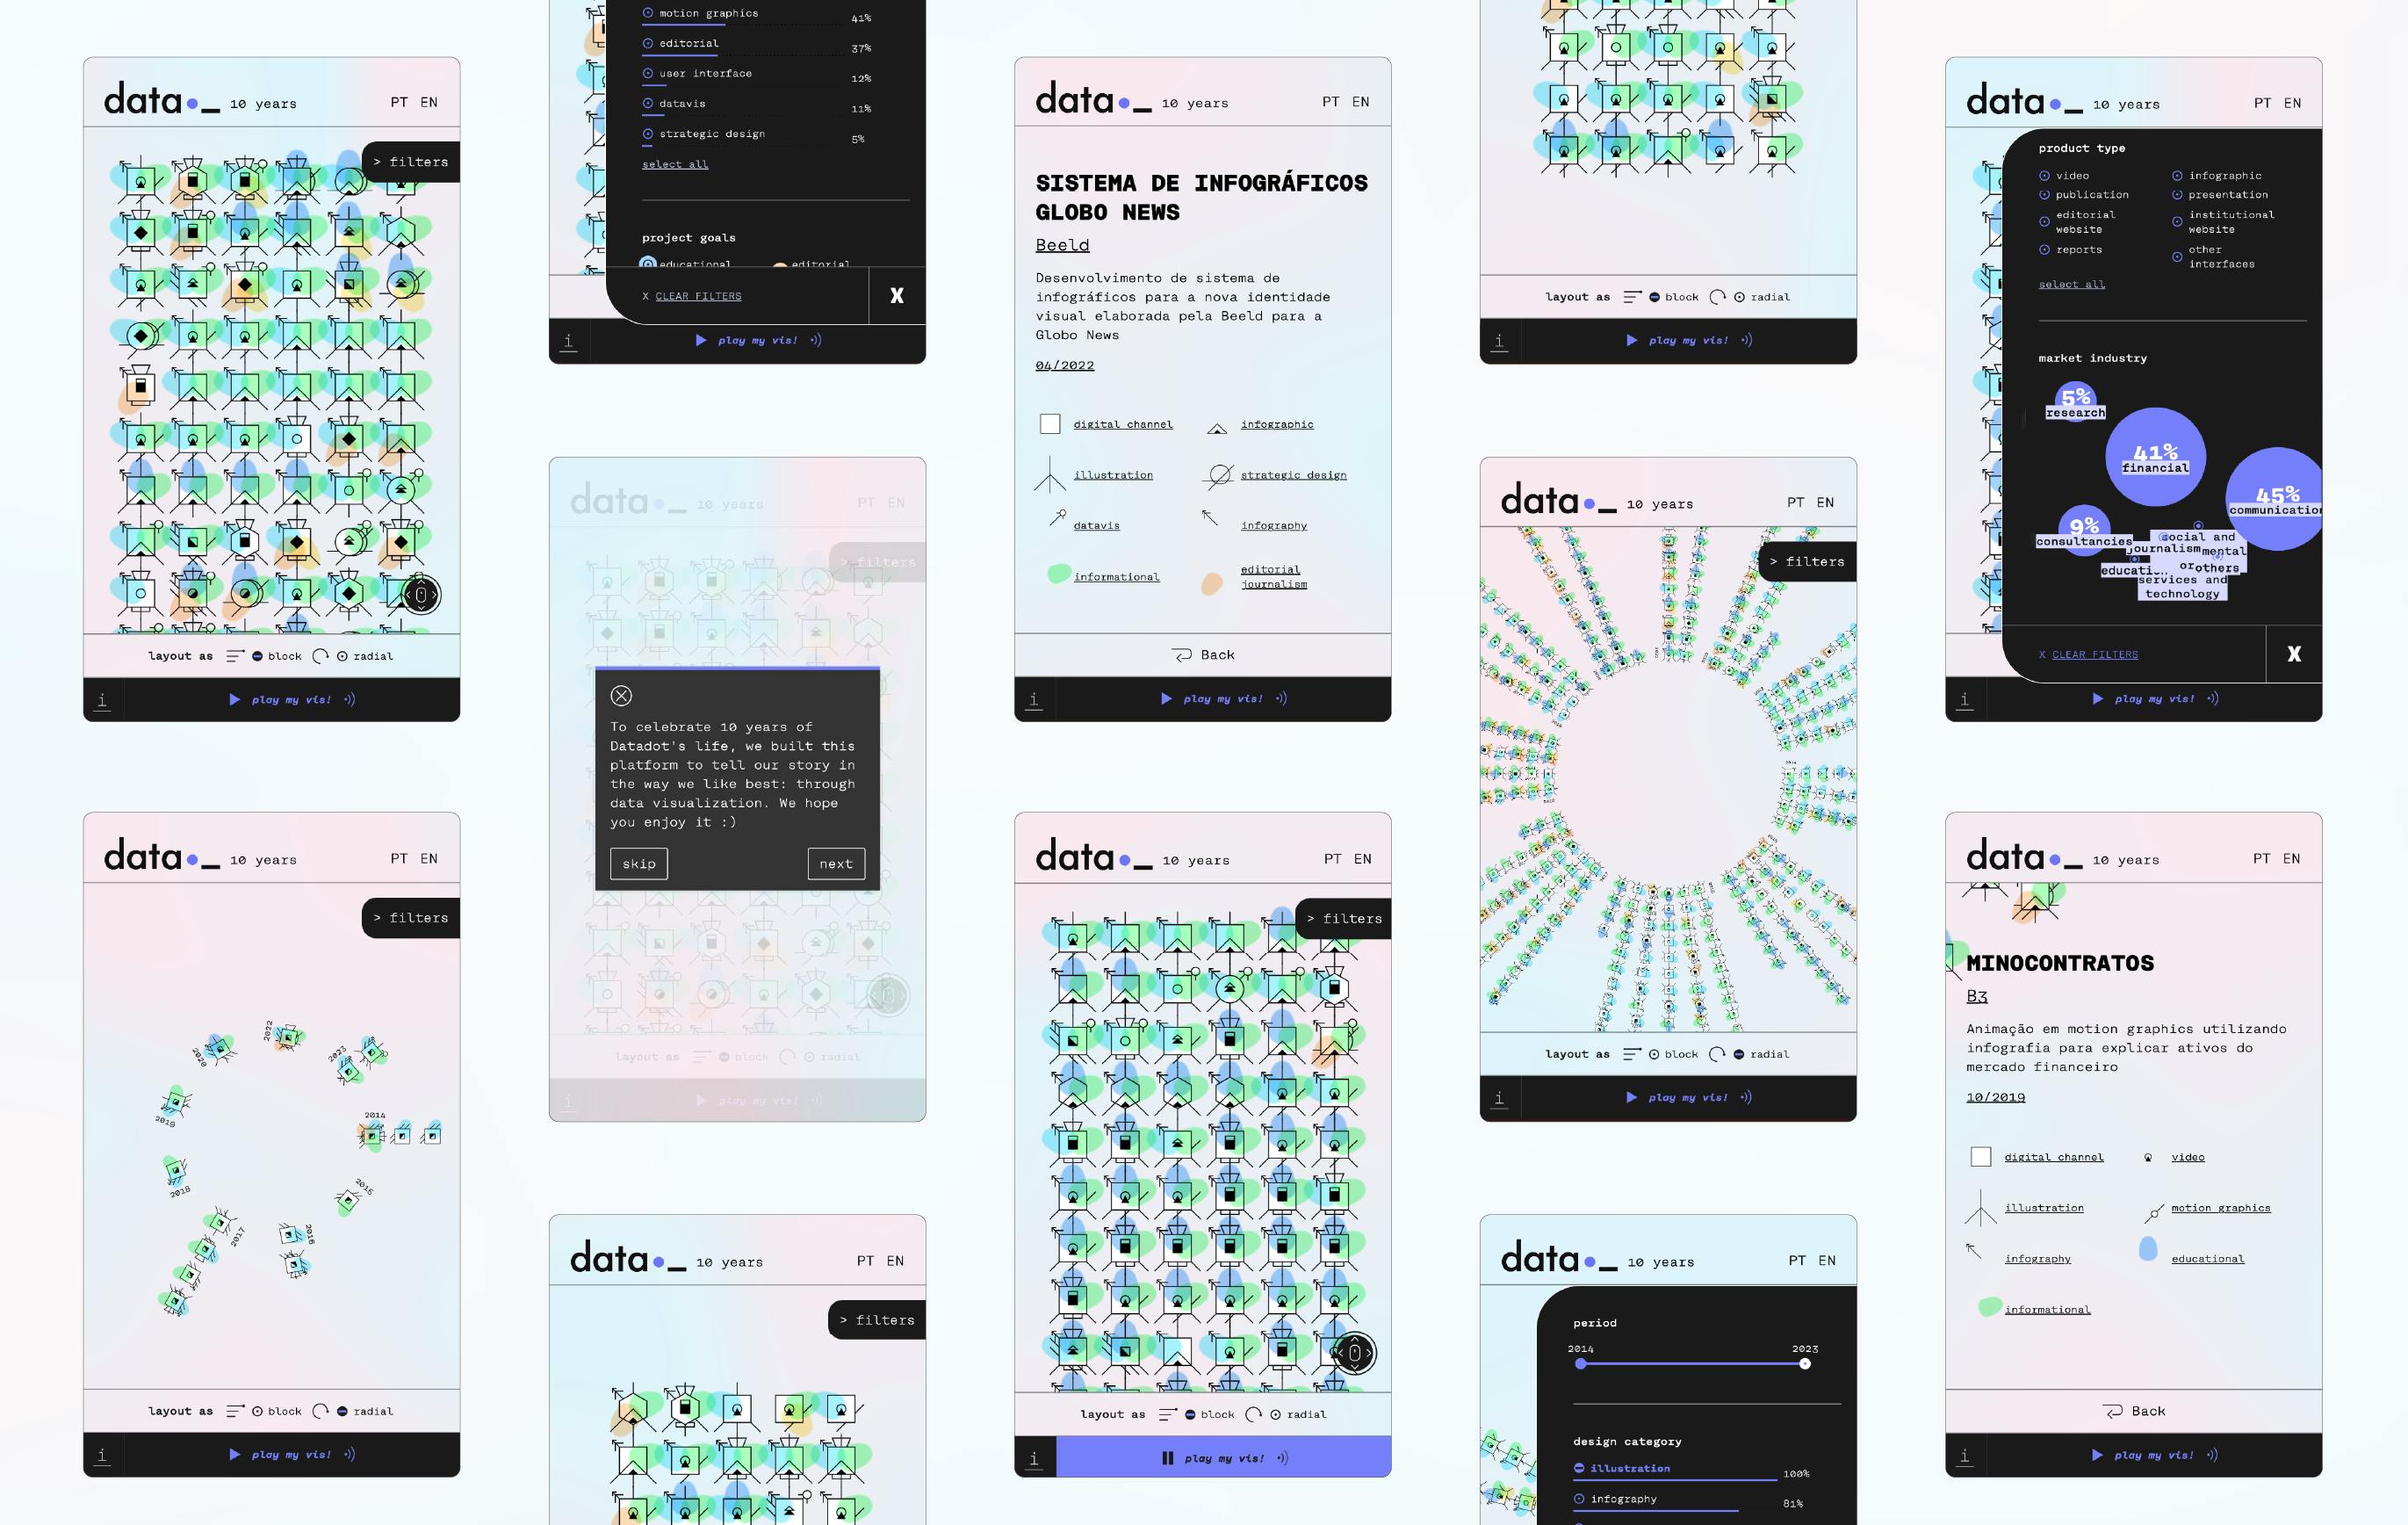
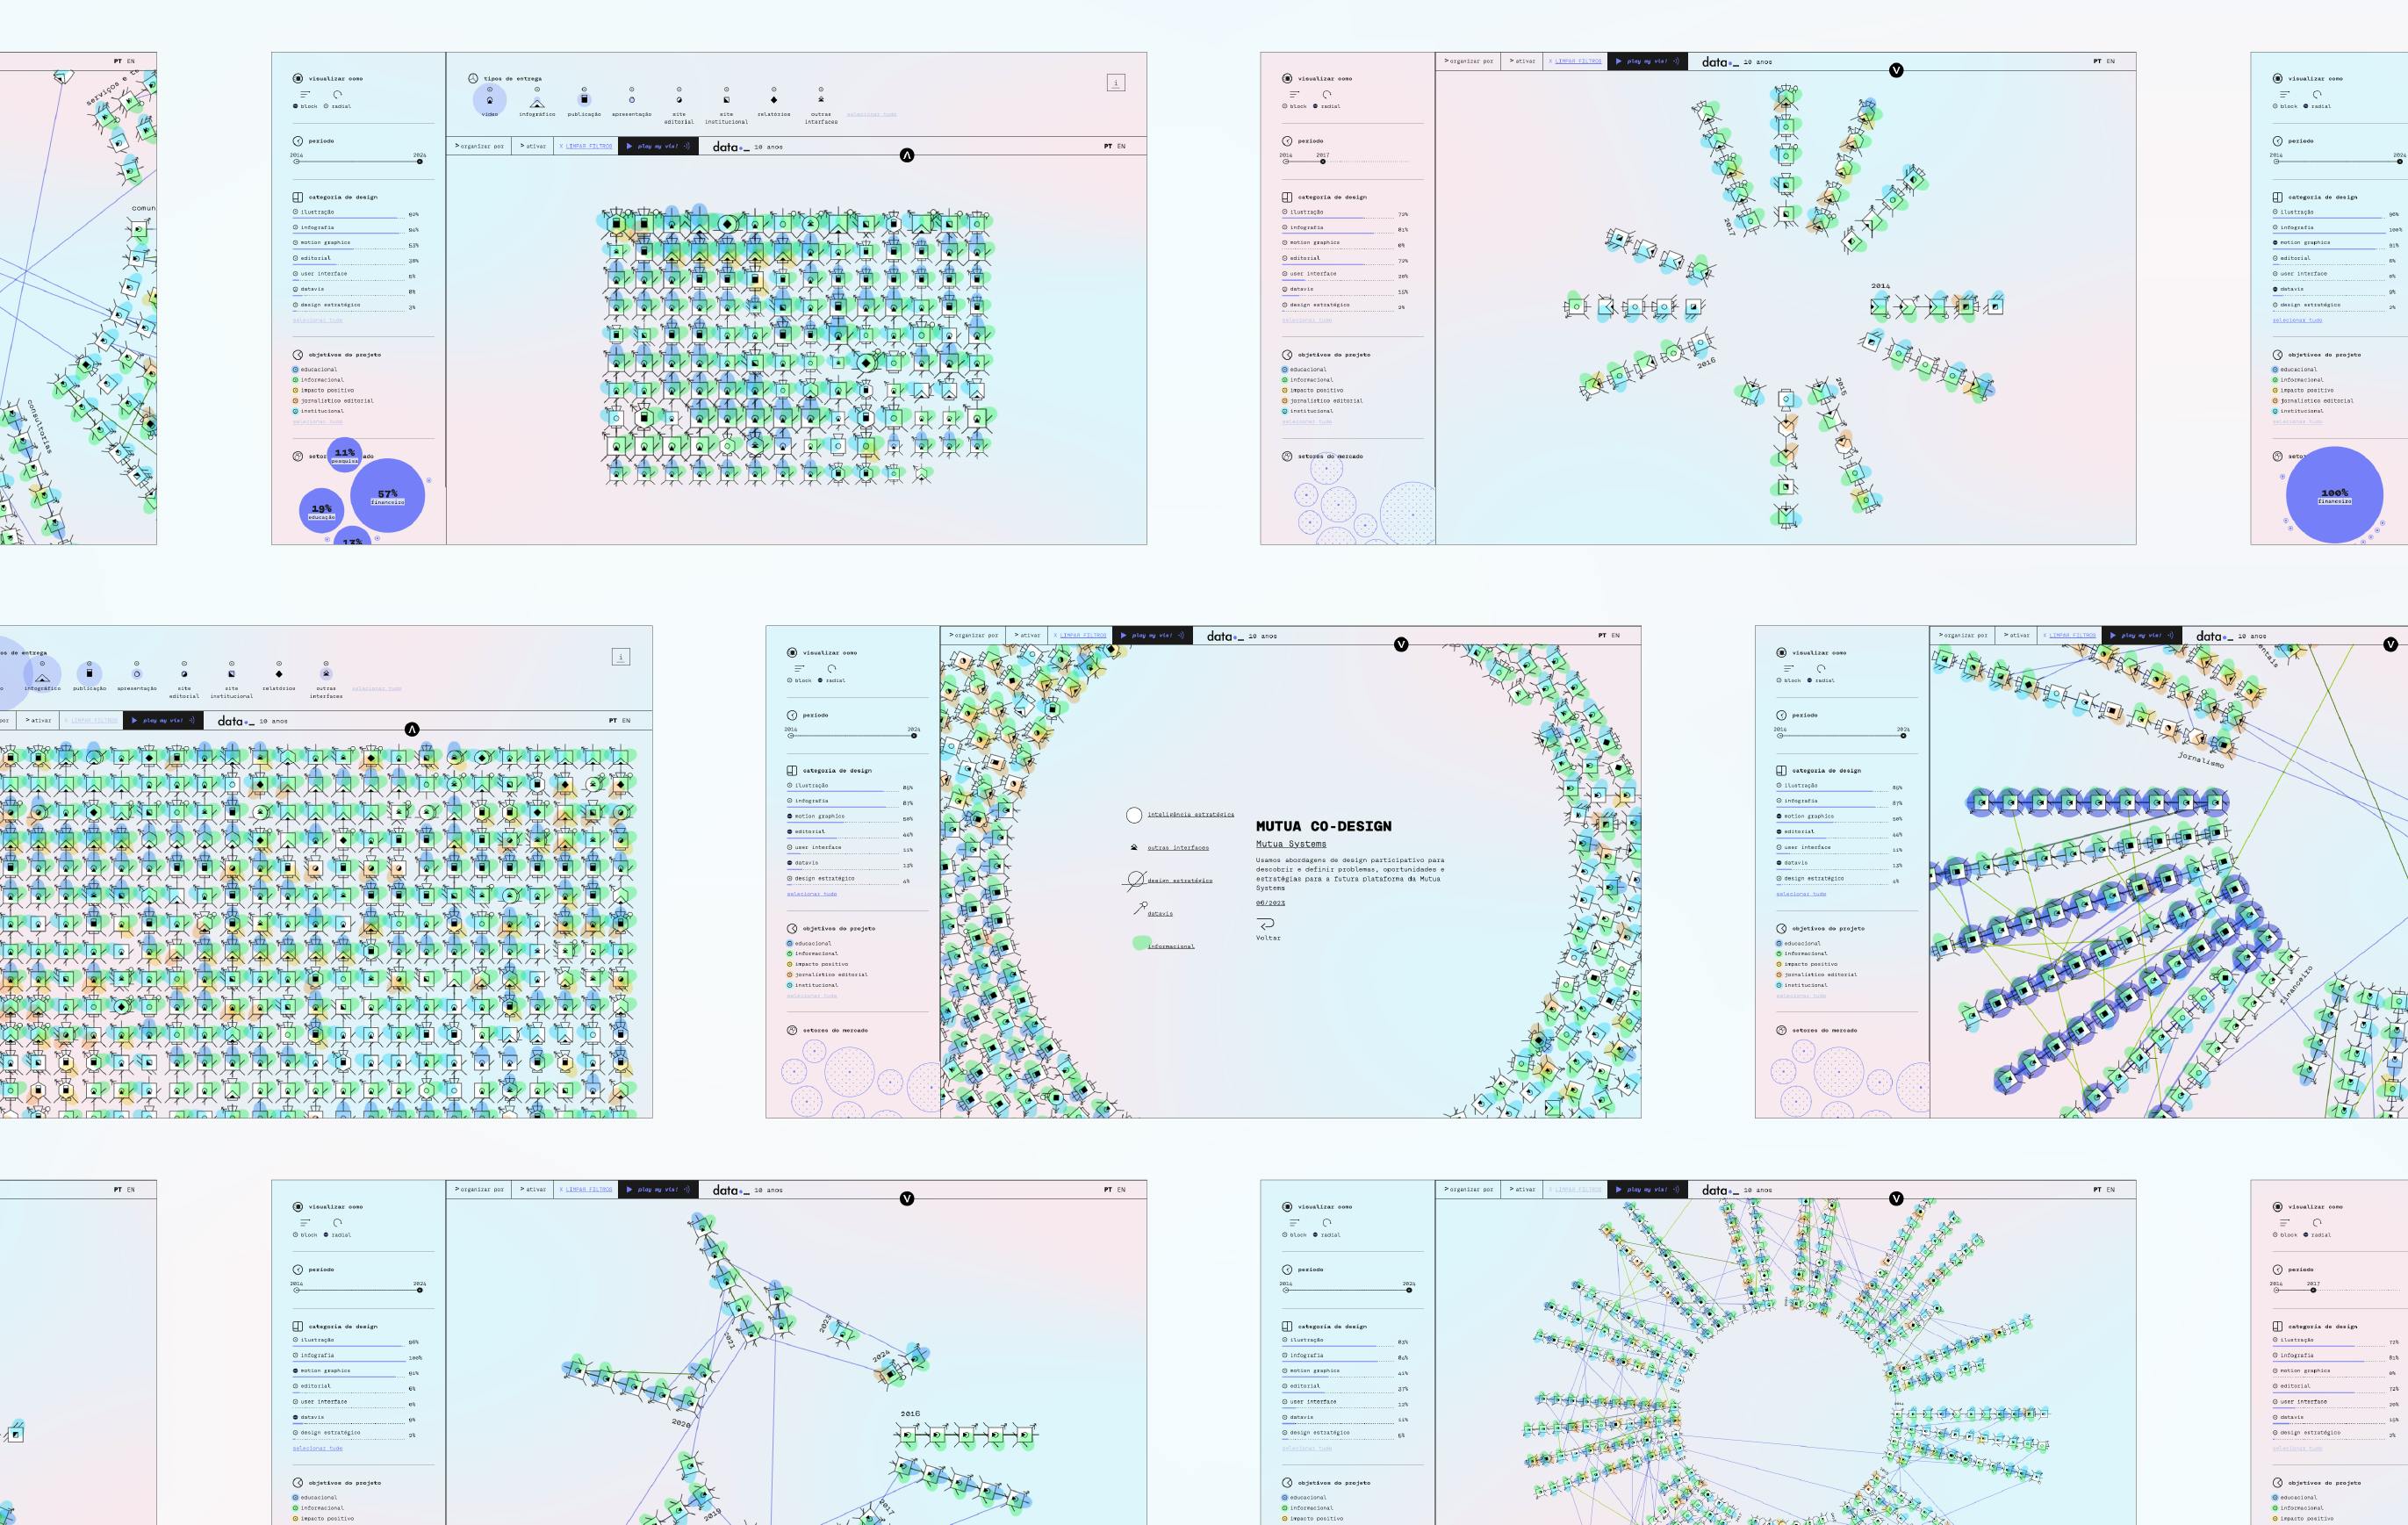
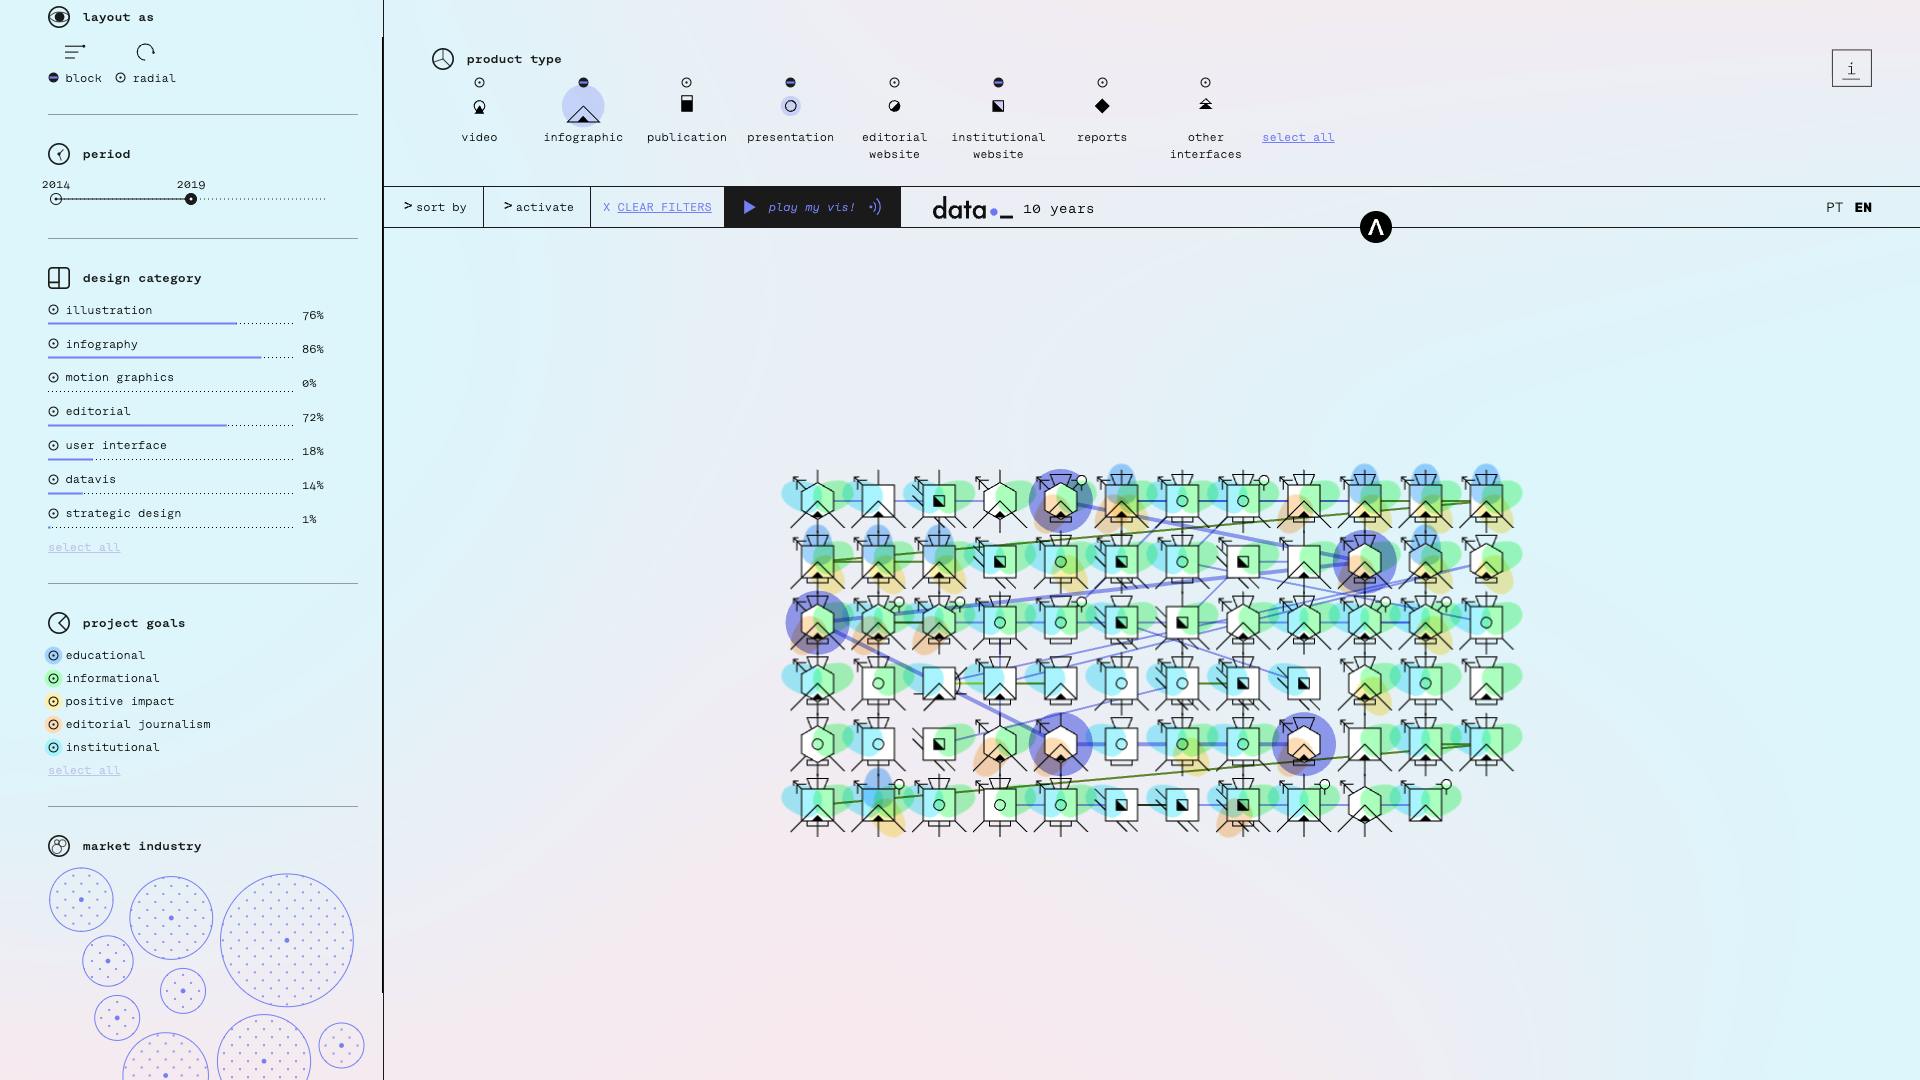
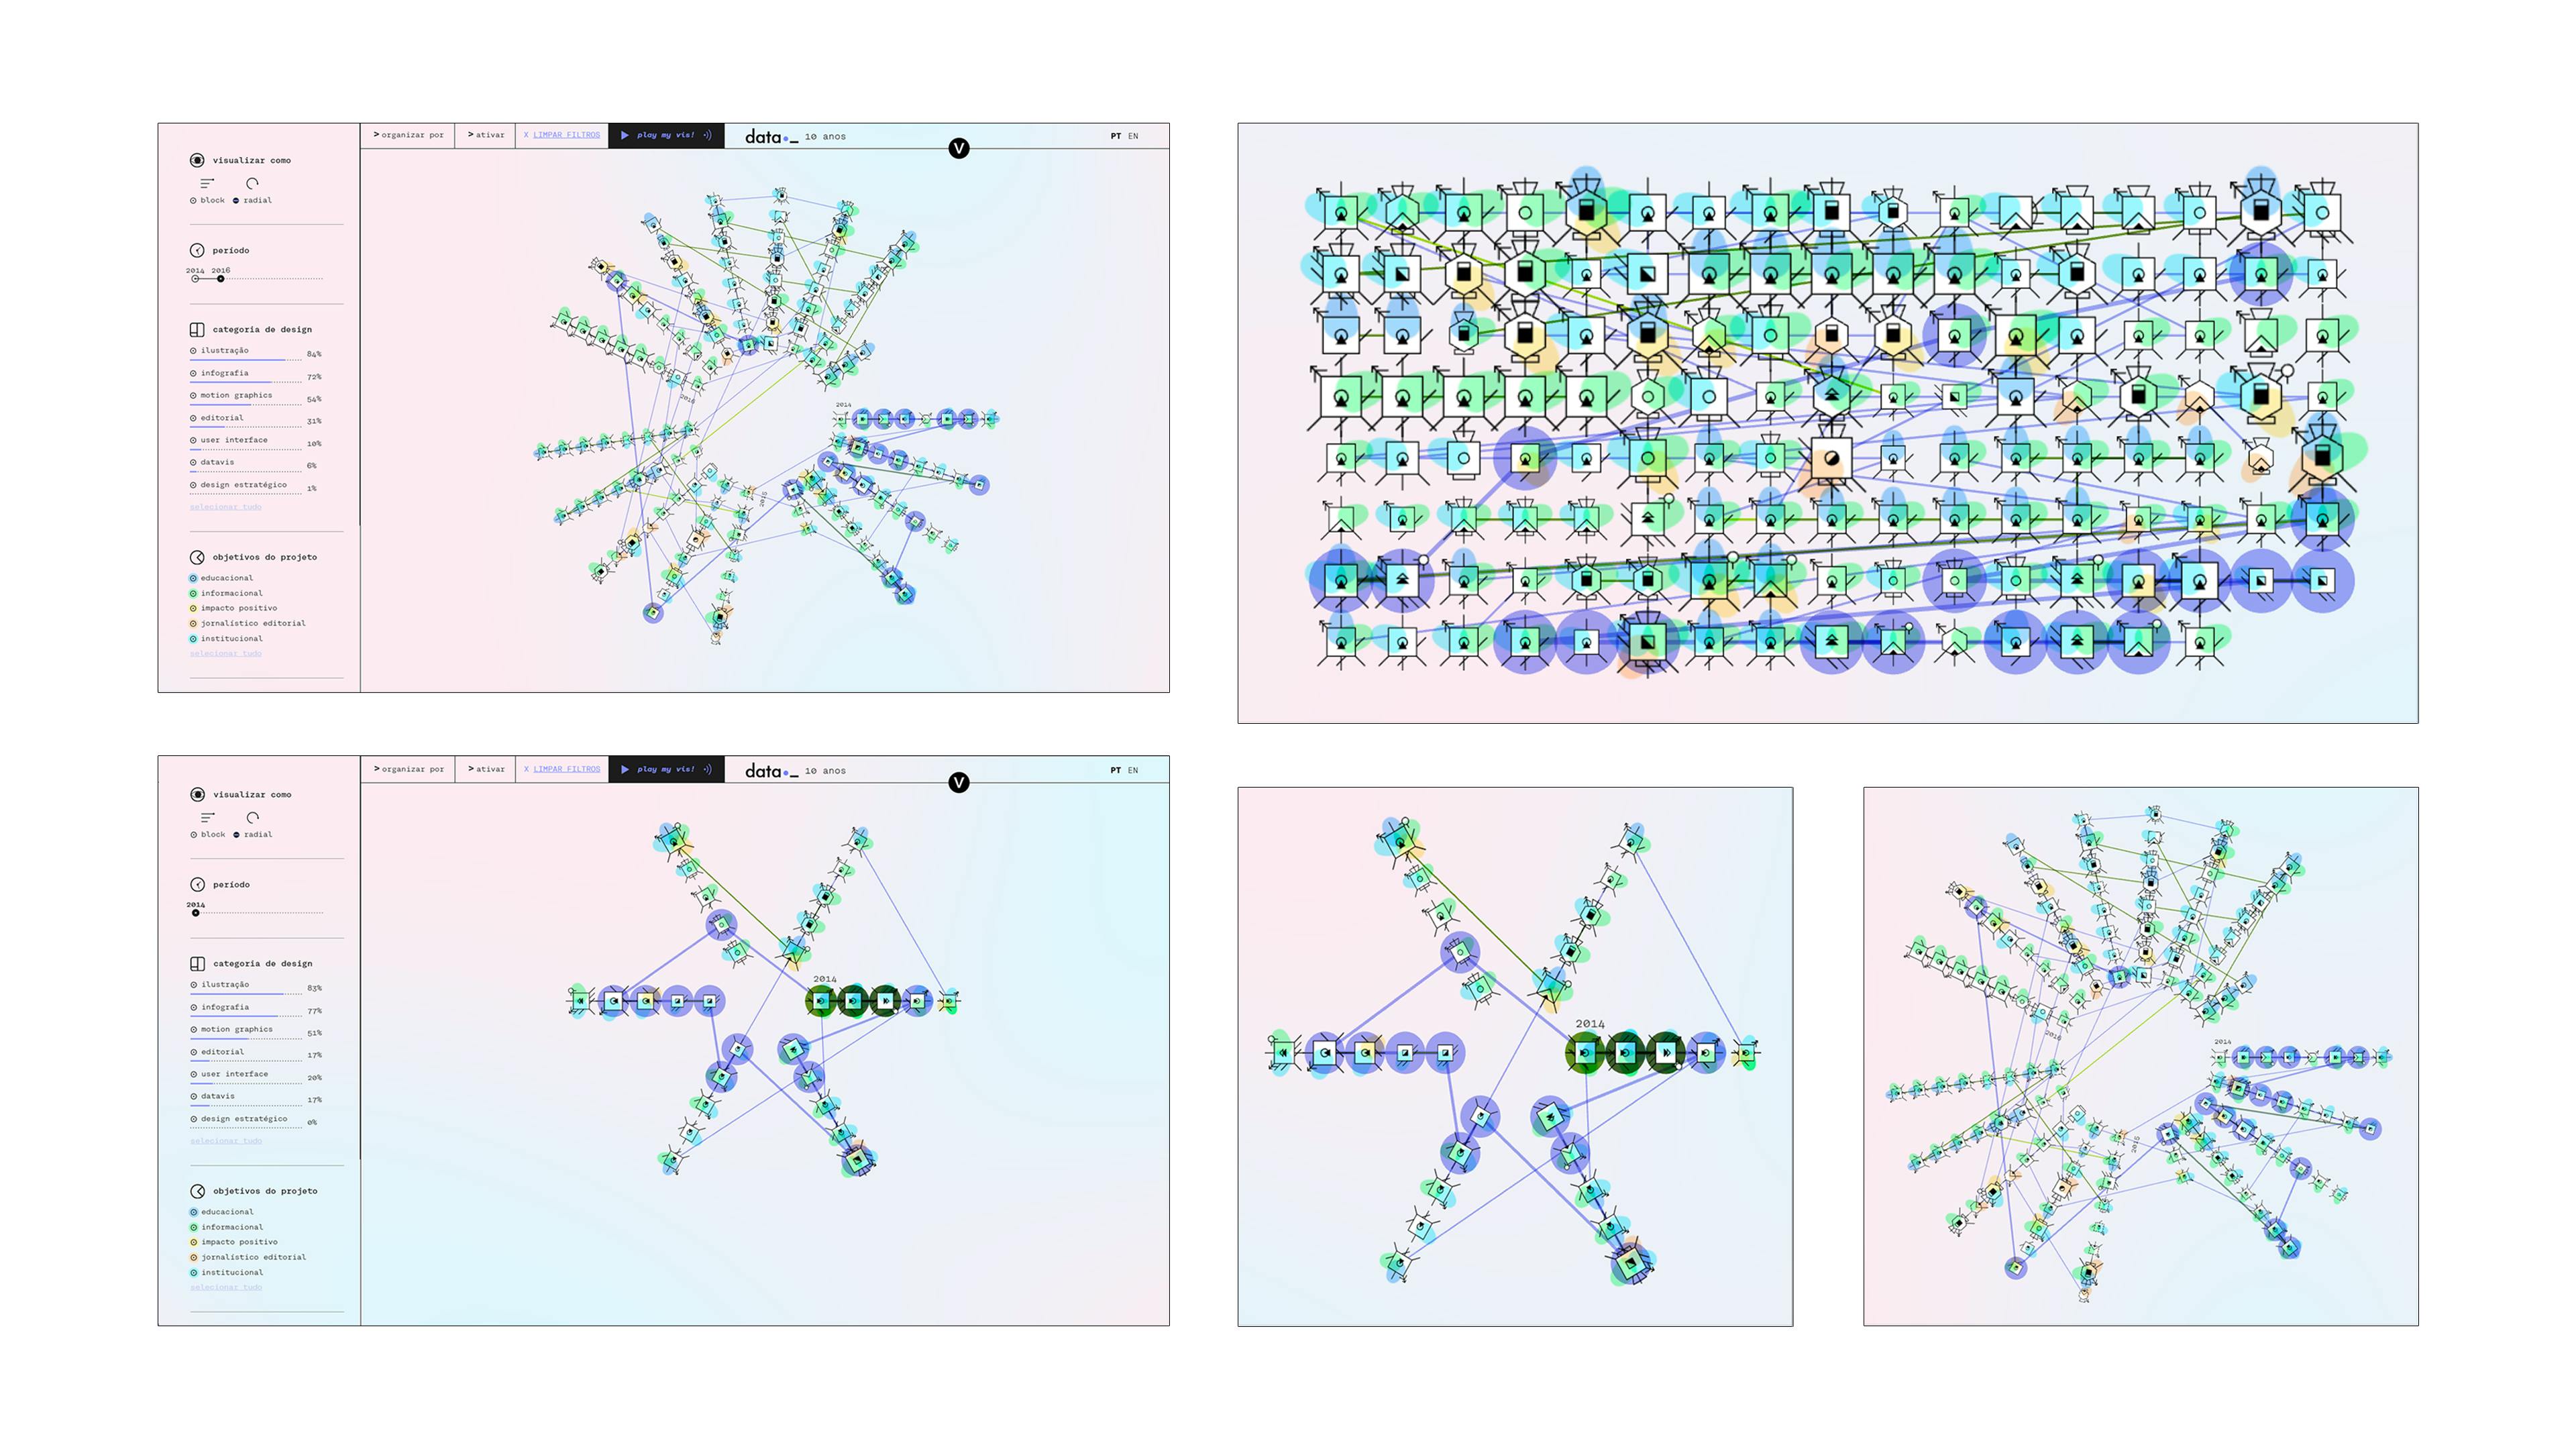
In 2024, we celebrated our 10th anniversary. To mark the occasion, we created an interactive visual experiment that allows people to explore our journey. The project started with immersion workshops to map possibilities and define directions. We chose to represent each deliverable—such as animations, websites, and infographics—as a unique visual node, combining variables from a database of our past decade’s projects. Our goal was to transform complexity into an inspiring visual experience, enabling multiple forms of interaction and interpretation. Filters help users explore quantitative data, select categories, and connect projects from the same client. Music also inspired our approach. We created the "play my vis" function, which sonifies data and turns our history into a complete sensory experience. With this approach, our decade of work becomes an engaging and interactive journey for everyone.